
MERO Clear connects stock balances, costs and inventory age. Start with the consolidated position and explore products, catalogue hierarchy and locations within your team’s access permissions.
Inventory capital: connect quantity with financial value
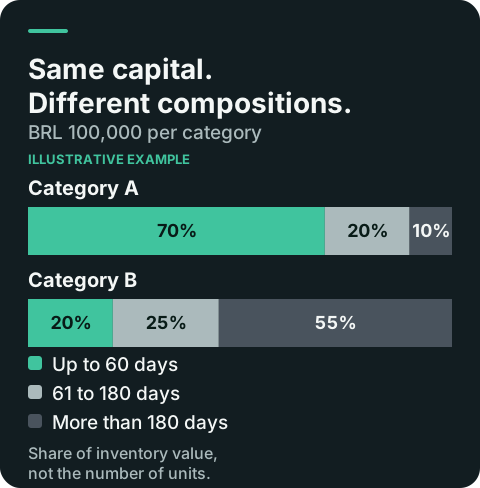
A unit count alone does not explain the distribution of investment in products. Clear supports inventory value analysis using supplied quantities and costs, bringing the financial weight of each scope into the discussion.
This value represents the inventory position being analyzed. It does not equal profit, available cash or expected returns. Consistent costs, balances and dates are essential for interpreting it.
Aging: distinguish recent receipts from older layers
Inventory age helps show how long capital has been associated with receipt layers still represented in the balance. Distribution across age bands complements the consolidated view and prevents an average from hiding the inventory composition.
An older layer needs context: seasonality, assortment strategy and product characteristics may affect the interpretation. The indicator raises a question to investigate; it does not prescribe the same action for every older product.
IMPE: an average that considers the financial weight of inventory
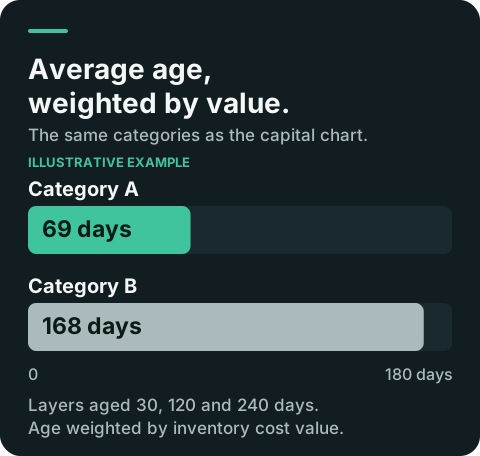
IMPE is the Portuguese acronym for Weighted Average Inventory Age. In Clear’s documented financial metric, the age of receipt layers is weighted by the cost value included in the calculation. Layers with a larger financial share therefore contribute more to the result.
Read the average alongside the reference date, age-band distribution and product details. It is a starting point for investigation, rather than a complete diagnosis of a SKU’s commercial performance.
Explore categories, products and locations
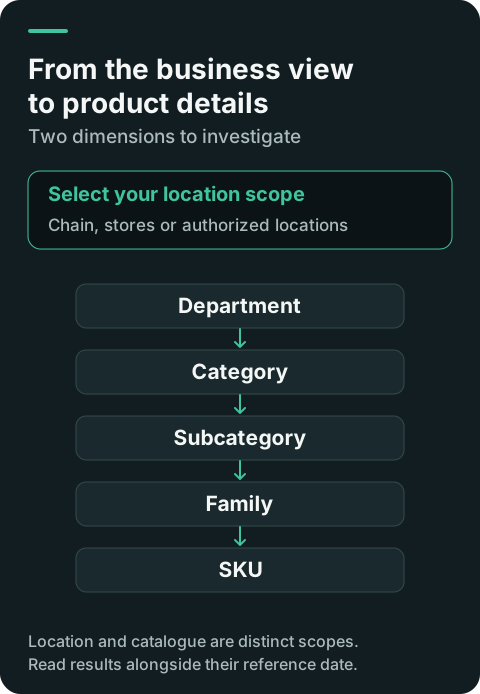
Start with the leadership question and select a scope: department, category, subcategory, family or SKU. Then investigate how inventory and capital are distributed across the locations the user is authorized to access.
This navigation helps purchasing, finance and operations discuss the same dataset while preserving the responsibilities and access scopes configured in the application.
Questions to bring to the demonstration
Where is our chain’s inventory capital concentrated? Which product families have a larger share of aged inventory? Does a category’s position change when we examine individual locations? Which products explain the displayed average?
These questions turn a demonstration into a conversation about your business. Answers depend on scope, data availability and the configuration of your operation.
Start with an evaluation with a defined scope
A POC can begin with a set of locations and products, using organized catalogue, cost, receipt and balance data. Pre-validation reports inconsistencies before loading; processing starts only after confirmation in the application.
The MERO team can discuss your questions and the data your operation can supply. There is no promise of a savings percentage, implementation deadline or financial outcome without a specific evaluation.